Sidebar
linux:firewall5
Table of Contents
Firewall Part 5
Firewall with iptables
In this part we will cover the topics listed below:
- telegraf
- Docker
- Alpine CGit
- influxdb
- portainer
- chronograf
telegraf
To get some test data into influxdb, we will install telegraf on lan01 and later on firewall01. This will monitor the performance.
user@lan01:~ $ cat <<EOF | sudo tee /etc/apt/sources.list.d/influxdata.list
deb https://repos.influxdata.com/ubuntu $(lsb_release -cs) stable
EOF
sudo curl -sL https://repos.influxdata.com/influxdb.key | sudo apt-key add -
user@lan01:~ $ sudo apt update
sudo apt install telegraf
user@lan01:~ $ sudo vi /etc/telegraf/telegraf.conf
look for section [[outputs.influxdb]] and add this
[[outputs.influxdb]]
  urls = ["http://127.0.0.1:8086"]
Restart telegraf
user@lan01:~ $ sudo systemctl restart telegraf
We will later check, if data is written to database
Docker
I assume, that Docker is already installed on your system, so I won't cover this in this article
List of containers covered
- Alpine-CGit
- influxdb
- Portainer
- Chronograph
- Grafana
- maybe more to follow

Alpine CGit
To keep track of what changed in the firewall, I created the following docker container.
user@lan01:~ $ mkdir -p Docker/cgit
user@lan01:~ $ cd Docker/cgit
user@lan01:~/Docker/cgit $ cat docker-compose.yml
---
version: '3'
services:
  alpine-cgit:
    image: joseluisq/alpine-cgit
    container_name: alpine-cgit
    ports:
      - "8080:80"
    volumes:
      - /home/git/repos:/srv/git
    restart: unless-stopped
user@lan01:~/Docker/cgit $ docker-compose up -d
user@lan01:~/Docker/cgit $ docker ps
CONTAINER ID   IMAGE                   COMMAND                  CREATED       STATUS         PORTS                                   NAMES
974e923e61e0   joseluisq/alpine-cgit   "/docker-entrypoint.…"   2 hours ago   Up 4 minutes   0.0.0.0:8080->80/tcp, :::8080->80/tcp   alpine-cgit
Screenshot Alpine CGit

influxdb
Before we create the influxdb & chronograf container, we need to create a new bridge network, to connect the two containers
user@lan01:~ $ docker network create influx_be
user@lan01:~ $ docker network ls
NETWORK ID     NAME           DRIVER    SCOPE
a22965261a7d   bridge         bridge    local
2dbbb165da55   cgit_default   bridge    local
2f5353e92b18   host           host      local
909247c285d0   influx_be      bridge    local
8b29f360b421   none           null      local
Also we need to create a volume for the influxdb data
user@lan01:~ $ docker volume create influxdb-data
user@lan01:~ $ docker volume ls
DRIVER    VOLUME NAME
local     6ed48a5448987a9895571b30ce21379436b663c88a8b4f63925a8378030c7478
local     2901b6242d467abcddd2aafce75f3dbc96beb4a81a7480320be6c90260bf25cc
local     influxdb-data
Now create a directory for the docker-compose.yml file
user@lan01:~/Docker/influxdb $ cat docker-compose.yml
version: "3"
services:
  influxdb:
    container_name: influxdb
    image: influxdb:1.8
    networks:
      - influx_be
    ports:
      - 8086:8086/tcp
    restart: unless-stopped
    volumes:
      - influxdb-data:/var/lib/influxdb
networks:
  influx_be:
    external: true
    name: influx_be

volumes:
  influxdb-data:
user@lan01:~/Docker/influxdb $ docker-compose up -d
To see if data arrives in database, open shell in influxdb container
user@lan01:~/Docker/influxdb $ docker exec -it influxdb /bin/bash
start influx client
root@042e3249a877:/# influx
Connected to http://localhost:8086 version 1.8.10
InfluxDB shell version: 1.8.10
>
List databases
> show databases
name: databases
name
----
_internal
telegraf
>
Select telegraf database
> use telegraf
Using database telegraf
>
Show Measurements
> show measurements
name: measurements
name
----
cpu
disk
diskio
kernel
mem
processes
swap
system
>
Request data
> select * from processes limit 10
name: processes
time                blocked dead host  idle paging running sleeping stopped total total_threads unknown zombies
----                ------- ---- ----  ---- ------ ------- -------- ------- ----- ------------- ------- -------
1652644022000000000 0       0    lan01 86   0      2       257      0       345   967           0       0
1652644030000000000 0       0    lan01 86   0      0       252      0       338   961           0       0
1652644040000000000 0       0    lan01 86   0      0       252      0       338   961           0       0
1652644050000000000 0       0    lan01 86   0      0       252      0       338   960           0       0
1652644060000000000 0       0    lan01 84   0      0       252      0       336   959           0       0
1652644070000000000 0       0    lan01 84   0      0       252      0       336   960           0       0
1652644080000000000 0       0    lan01 84   0      1       251      0       336   960           0       0
1652644090000000000 0       0    lan01 84   0      0       255      0       339   962           0       0
1652644100000000000 0       0    lan01 84   0      0       255      0       339   962           0       0
1652644110000000000 0       0    lan01 84   0      0       255      0       339   962           0       0
>
Portainer
Create directory for portainer
user@lan01:~ $ mkdir Docker/portainer
user@lan01:~ $ cd Docker/portainer
Create volume for portainer data
user@lan01:~Docker/portainer $ docker volume create portainer_data
Now create the container
user@lan01:~Docker/portainer $ cat docker-compose.yml
version: '3'

services:
  portainer:
    image: portainer/portainer-ce:latest
    container_name: portainer
    restart: unless-stopped
    security_opt:
      - no-new-privileges:true
    volumes:
      - /etc/localtime:/etc/localtime:ro
      - /var/run/docker.sock:/var/run/docker.sock:ro
      - portainer_data:/data
    ports:
      - 9000:9000

volumes:
  portainer_data:
Three containers should be up and running
user@lan01:~Docker/portainer $ docker ps --format 'table {{.Names}}\t{{.Image}}'
portainer	portainer/portainer-ce:latest
influxdb	influxdb:1.8
alpine-cgit	joseluisq/alpine-cgit
You can connect to the Portainer web frontend via browser now

Enter a password an click on Create user
Select Connect to local environment

Click on below entry in portainer
Three containers will show up, if everything is ok

Chronograph
Create directory for chronograf and cd into it
user@lan01:~ $ mkdir Docker/chronograf
user@lan01:~ $ cd Docker/chronograf
Create volume for chronograf data
user@lan01:Docker/chronograf $ docker volume create chronograf-data
Create docker-compose.yml file
user@lan01:Docker/chronograf $ cat docker-compose.yml
version: "3"
services:
  chronograf:
    container_name: chronograf
    image: chronograf
    networks:
      - influx_be
    ports:
      - 8888:8888/tcp
    restart: unless-stopped
    volumes:
      - chronograf-data:/var/lib/chronograf
networks:
  influx_be:
    external: true
    name: influx_be

volumes:
  chronograf-data:
Start container
user@lan01:Docker/chronograf $ docker-compose up -d
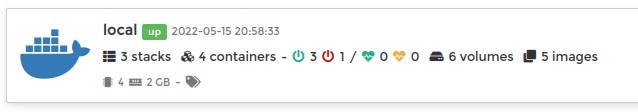
In portainer you should see 4 containers now

Important fact is, that influxdb and chronograf container share the same network.
In Networks section of portainer, you can see, that this network is the network we created earlier.
The good fact is, that you can access the containers by name in that network.
To check this, start a shell in influxdb container and ping chronograf
user@lan01:Docker/chronograf$ docker exec -it influxdb /bin/bash

root@042e3249a877:/# ping chronograf
PING chronograf (172.19.0.3) 56(84) bytes of data.
64 bytes from chronograf.influx_be (172.19.0.3): icmp_seq=1 ttl=64 time=0.155 ms
64 bytes from chronograf.influx_be (172.19.0.3): icmp_seq=2 ttl=64 time=0.100 ms
64 bytes from chronograf.influx_be (172.19.0.3): icmp_seq=3 ttl=64 time=0.093 ms
^C
--- chronograf ping statistics ---
3 packets transmitted, 3 received, 0% packet loss, time 2006ms
rtt min/avg/max/mdev = 0.093/0.116/0.155/0.027 ms
root@042e3249a877:/#
This works!
You can see, that fqdn is chronograf.influx_be.
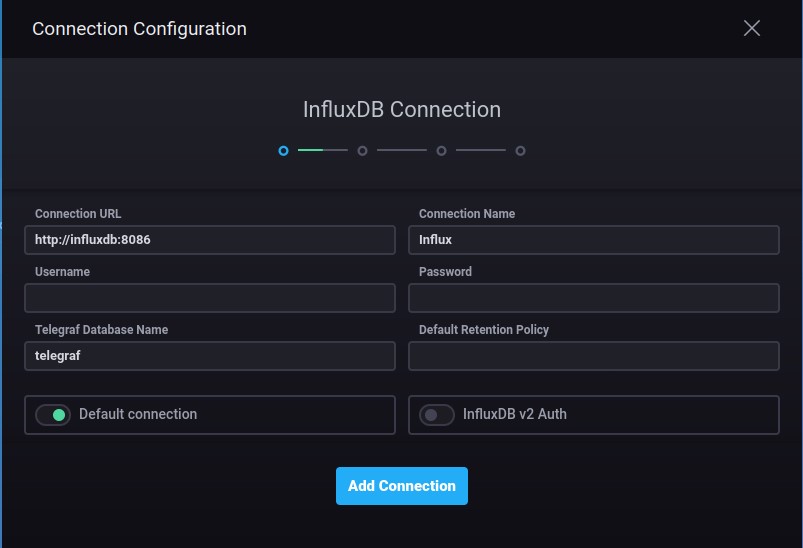
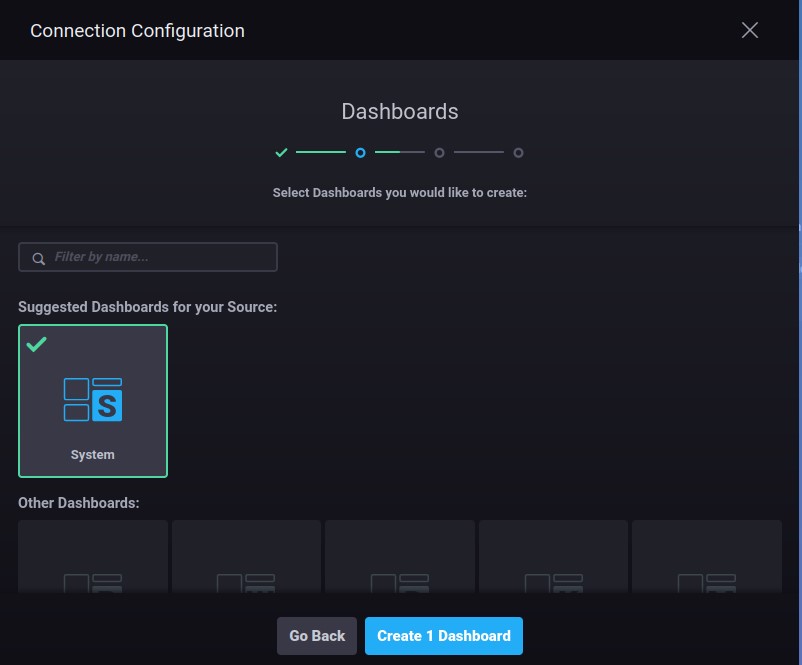
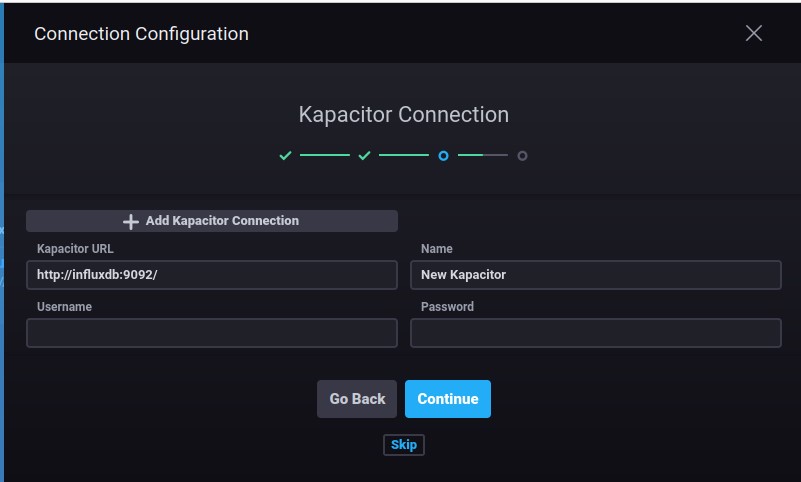
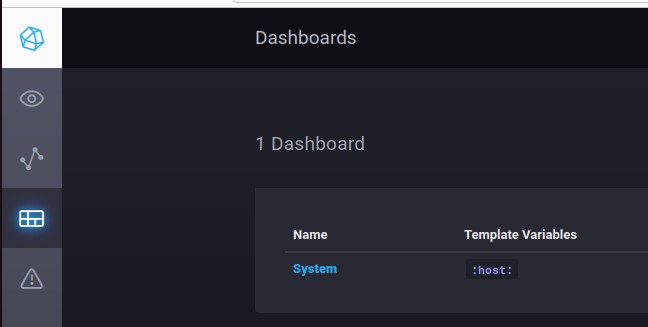
Now visit http://localhost:8888 on lan01 and create your first connection & dashboard in chronograf


Now we know, that data is arriving in influxdb.
telegraf on firewall01
To install telegraf on the firewall, follow the installation procedure here
After the installation, we need to configure telegraf on the firewall. Please adjust as follows
user@fw01:~/scripts/firewall $ sudo cat /etc/telegraf/telegraf.conf | grep -v '#' | sed '/^$/d'
[global_tags]
[agent]
  interval = "10s"
  round_interval = true
  metric_batch_size = 1000
  metric_buffer_limit = 10000
  collection_jitter = "0s"
  flush_interval = "10s"
  flush_jitter = "0s"
  precision = ""
  hostname = ""
  omit_hostname = false
[[outputs.influxdb]]
  urls = ["http://192.168.38.2:8086"]
  database = "firewall01"
[[inputs.cpu]]
  percpu = true
  totalcpu = true
  collect_cpu_time = false
  report_active = false
[[inputs.disk]]
  ignore_fs = ["tmpfs", "devtmpfs", "devfs", "iso9660", "overlay", "aufs", "squashfs"]
[[inputs.diskio]]
[[inputs.kernel]]
[[inputs.mem]]
[[inputs.processes]]
[[inputs.swap]]
[[inputs.system]]
 [[inputs.conntrack]]
    files = ["ip_conntrack_count","ip_conntrack_max",
             "nf_conntrack_count","nf_conntrack_max"]
    dirs = ["/proc/sys/net/ipv4/netfilter","/proc/sys/net/netfilter"]
[[inputs.net]]
[[inputs.netstat]]
After saving, we need to restart the telegraf service
user@fw01:~/scripts/firewall $ sudo systemctl restart telegraf
…and check status
user@fw01:~/scripts/firewall $ sudo systemctl status telegraf
● telegraf.service - The plugin-driven server agent for reporting metrics into InfluxDB
     Loaded: loaded (/lib/systemd/system/telegraf.service; enabled; vendor preset: enabled)
     Active: active (running) since Sun 2022-05-29 12:37:49 CEST; 8s ago
       Docs: https://github.com/influxdata/telegraf
   Main PID: 1457 (telegraf)
      Tasks: 8 (limit: 992)
     Memory: 55.6M
        CPU: 405ms
     CGroup: /system.slice/telegraf.service
             └─1457 /usr/bin/telegraf -config /etc/telegraf/telegraf.conf -config-directory /etc/telegraf/telegraf.d
We will use a different influx database for the firewall database = “firewall01”
To check, if data arrives at the influx docker container, we start a shell in the container and directly execute the influx binary
user@lan01:~$ docker exec -it influxdb influx
Connected to http://localhost:8086 version 1.8.10
InfluxDB shell version: 1.8.10
>
List databases
show databases
name: databases
name
----
_internal
telegraf
firewall01
>
Switch to database firewall01
> use firewall01
Using database firewall01
List all measurements in that database
> show measurements
name: measurements
name
----
conntrack
cpu
disk
diskio
kernel
mem
net
netstat
processes
swap
system
>
Request some data
> select * from processes limit 10
name: processes
time                blocked dead host       idle paging running sleeping stopped total total_threads unknown zombies
----                ------- ---- ----       ---- ------ ------- -------- ------- ----- ------------- ------- -------
1653821430000000000 0       0    firewall01 82   0      0       128      0       210   248           0       0
1653821440000000000 1       0    firewall01 81   0      0       128      0       210   249           0       0
1653821450000000000 0       0    firewall01 82   0      0       128      0       210   249           0       0
1653821460000000000 0       0    firewall01 82   0      0       128      0       210   249           0       0
1653821470000000000 0       0    firewall01 82   0      0       128      0       210   249           0       0
1653821480000000000 0       0    firewall01 82   0      0       128      0       210   249           0       0
1653821490000000000 0       0    firewall01 82   0      0       128      0       210   249           0       0
1653821500000000000 1       0    firewall01 81   0      0       128      0       210   249           0       0
1653821510000000000 0       0    firewall01 82   0      0       128      0       210   249           0       0
1653821520000000000 0       0    firewall01 82   0      0       128      0       210   249           0       0
>
Now create a new chronograf connection under the configuration tab


linux/firewall5.txt · Last modified: by stefan
Page Tools
Except where otherwise noted, content on this wiki is licensed under the following license: CC Attribution-Share Alike 4.0 International
